Check out what one of the best in the online marketing business, MOZ finds imortant

Showing posts with label online marketing. Show all posts
Showing posts with label online marketing. Show all posts
Sunday, 5 March 2017
Friday, 9 December 2016
Wednesday, 7 December 2016
Brand Commerce: Navigating through online customer indecision

Congratulations! So you’ve done a great job and attracted some visitors to your website.
Unfortunately now the really hard part begins, convincing said visitors to part with their hard earned money and turning them into customers.
With 68.8% of online baskets being abandoned, this is no small feat.
As marketers we tend to think that abundance of choice in products is one of the key strengths of ecommerce.
But without proper management and structure, this can become a hindrance and not necessarily result in more sales.
For this article we will go through some of the most common reasons behind customer indecision and showcase the brands that are successfully circumventing them through active “Choice Reduction”.
Facing the tyranny of choice
Now faced with the possibility of finding and buying anything online, we see more and more customers unable to commit to making a purchase then and there.
They instead become afflicted by choice paralysis. Unfortunately choice paralysis isn't something only suffered by your new customers. Even those that enter your site having already made a decision can find themselves inundated by all the options available to them and start to question whether theirs is the right one.
In the worst-case scenario, the customers will leave the site and never re-enter the customer journey, instead reverting back to their existing shopping behaviour and just buy from the brand they normally do.
This is because when we fear making a bad decision, we would often rather remove ourselves from the situation and make no decision at all.
The answer to this is simple, albeit for many brands an impractical one; reduce choice paralysis by limiting the number of visible alternatives available to your consumers.
When this isn't a possibility, there is a need to clearly differentiate between the different options available.
Relatable product taxonomy
Up until recently, when visiting IKEA’s website you were served with over ten categories in the top navigation.
In a more recent version rolled out as a test in September in the UK and Ireland, the Swedish furniture company moved towards a much clearer taxonomy, organising all the content under just four categories; ‘Products', ‘ Rooms’, ‘Ideas' and 'This is IKEA’.
Allowing users to find products not only through ‘Products’ but also through ‘Rooms’ allows for a more natural categorisation of products.
The addition of ‘Ideas’ to the mix allows the brand to bundle content while suggesting related products. All in all, providing the user with a simple and easy to navigate experience and an organisation of products more relatable to the customers.

Ending shopper procrastination
The introduction of shopping lists has allowed online shoppers to save products and make sense of the vast selections available from e-retailers such as ASOS.
A tool initially designed to single out products, for many it ends up introducing both procrastination and complexity into the customer journey.
Without a limit to amounts of products you can add to a list, you end up mimicking the main ecommerce experience, risking further choice paralysis. ASOS has introduced some limitations to its lists, namely only allowing products on the list for 60 days before being automatically removed.
There are also some other examples e-retailers can learn from. One such example is Priority, O2’s deal oriented app for its subscribers.
For many of the deals run on the app, O2 cleverly links discounts and rewards with time limits. Before choosing to redeem an offer, users are warned that they have a limited amount of time to use said offer.
By adding a sense of urgency, the app pushes the user to commit to the purchase and cuts down on potential procrastination.
This same mechanic can be adapted to e-retailers as well. For example, in cases of prolonged user inactivity, by triggering time limited discounts or free shipping if the purchase is completed within a pre-determined time frame.

Removing the last obstacles
When asked in research done by Baymard Institute, 61% of customers declare extra costs as the key reason behind abandoning their online shopping cart.
For many e-commerce sites, shipping costs, insurance and other things are hidden until the last minute. While it might be to mask and lower the perceived cost of making an online purchase, these operators are in fact undermining themselves.
Others such as the fashion brand Reiss are instead upfront with their extra costs. On Reiss’ website, the brand clearly states the different levels of shipping available and the cost the customer can expect. The brand also allows those more concerned with shipping costs to collect their purchase in store.

In the same study, 24% of respondents say they abandoned their cart because they couldn't see the final cost upfront. ASOS counteracts this by allowing the customer to change the type (and cost) of delivery from a dropdown in the shopping basket.
At the same time, through a notification ASOS cleverly tries to trigger the customer into a sale by offering a next-day delivery promo code.

While there are several other very effective tactics such as retargeting ads and basket reminder emails, these should be seen more as remedies to treat symptoms and not as relevant solutions to the problem; getting more people to commit to a purchase while on your site.
The methods referenced are some of the simplest and easy-to-implement ways of removing customer indecision from your customer's journey and nudging them into making a purchase.
Monday, 14 November 2016
10 Metrics to Track for Social Media Success
Wondering which social media metrics you should focus on?
Analyzing the raw data on campaign performance helps you determine which tactics are working.
In this article, you’ll discover the top 10 social media metrics you should be monitoring on Facebook and Twitter.
#1: Track Follower Growth
Your total count of fans, followers, and page likes represents the number of unique people who have taken an interest in your business. Ideally, you should consistently grow your following. This means the content you’re sharing and the ways you’re engaging your audience need to be enticing enough to attract new fans.
Facebook
On Facebook, it’s easy to get a detailed analysis of your number of page likes. Go to your page and click the Insights tab. Then click Likes in the left navigation.
You’ll see your total likes, as well as gains and losses of likes over a designated time period. This lets you monitor your audience’s reactions to certain posts or determine which time periods are best for bringing in new fans.
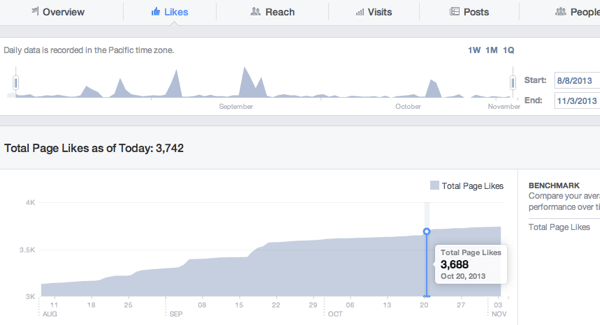
View your total number of page likes in Facebook Insights.
Twitter
On Twitter, you can find your follower count on your Twitter account page.
To view trends and statistics for your followers, visit Twitter Analytics. Click on your profile picture at the top right of any Twitter page and choose Analytics from the drop-down menu.
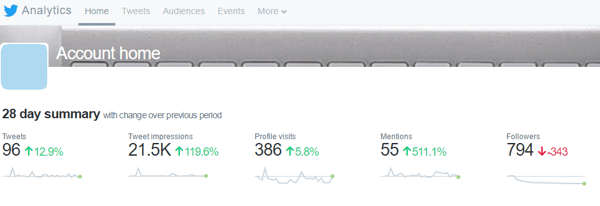
Go to the Home tab of your analytics to view trends and statistics for your Twitter followers.
The data at the top of the page shows a continuous 28-day summary, with information on your followers on the far right. You can see gain/loss trends for recent followers. Scroll down to see a summary for previous months, which includes changes in followers.
#2: Identify Optimal Times for Engagement
Knowing when your audience is most likely to engage with your content is important. It helps you tailor your strategy so you post your content at the right time (when your audience is most active) and the best days of the week.
Facebook
On Facebook, you can view your followers’ daily activity over the last week. By narrowing it down to individual days, you can see how engagement shifts by the hour.
On your Insights page, click Posts in the left navigation and make sure When Your Fans Are Online is selected at the top. Then hover over the different days of the week(Sunday through Saturday) at the top of the Posts tab.
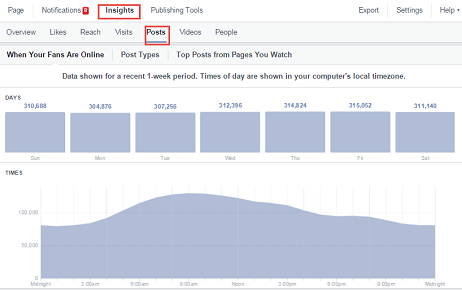
Go to the Posts tab under Insights to view your Facebook followers’ daily activity.
Twitter
Twitter data is a little less comprehensive, as it doesn’t provide engagement statistics for specific times throughout the day. However, you can still see how engagement rises and falls by day over the last 28 days (default) or another designated time period.
To find this information in your analytics, click the Tweets tab at the top of the page.
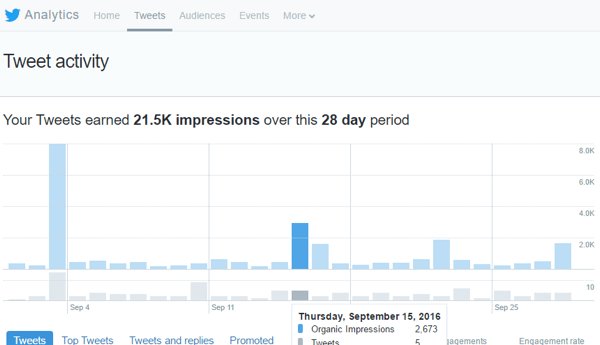
The Tweets tab shows engagement data for your Twitter account.
#3: Track Likes and Reactions for Your Posts
Gauging how your audience reacts to the content you post and share is crucial for any marketing strategy. This direct response metric helps you determine whether your audience is interested in what you’re currently publishing, and should inform the type of content you share in the future.
If your only engagement is chirping crickets on certain topics, cut that content from your editorial calendar or send those articles through another channel to a different audience segment that might be more receptive.
Facebook
Facebook provides more in-depth measurements with its updated reaction system, which lets you know whether your fans like, love, dislike, or are upset by something you shared.
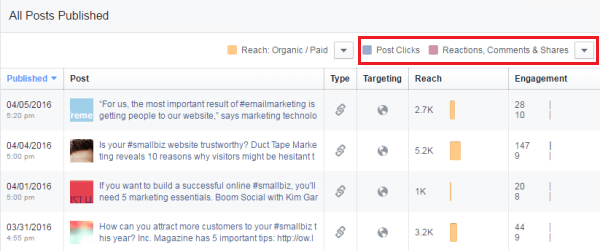
To find this information, go to your Insights page and click the Posts option in the left navigation. Then scroll down to All Posts Published and click on the right drop-down arrow to view Reactions, Comments, and Shares.
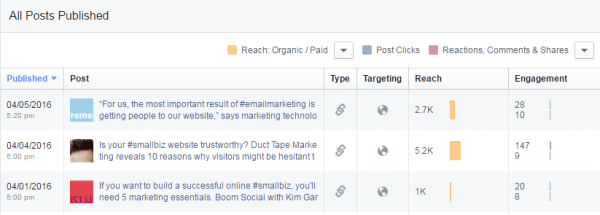
View engagement data for your Facebook posts.
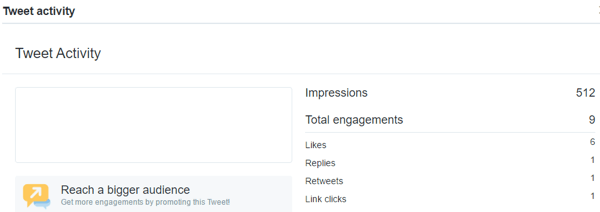
The data in the Engagement column measures the total reactions for a post. If you want to see a more detailed look at a post’s performance, click on the post link to view the breakdown of reactions from your audience.
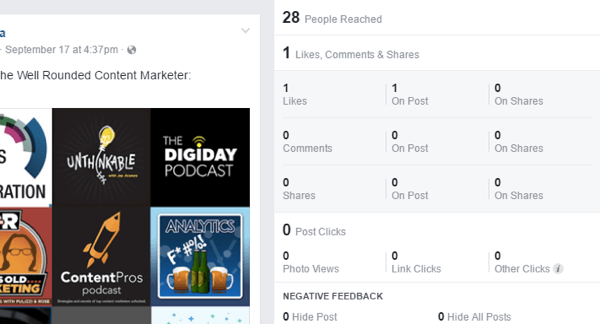
See a reactions breakdown for a specific Facebook post.
Twitter
Twitter has a similar approach and displays all of your tweets for a selected timeframe. To find this data in your analytics, click the Tweets tab at the top and scroll down to view your tweets. You can also click Top Tweets to view only your most popular tweets.
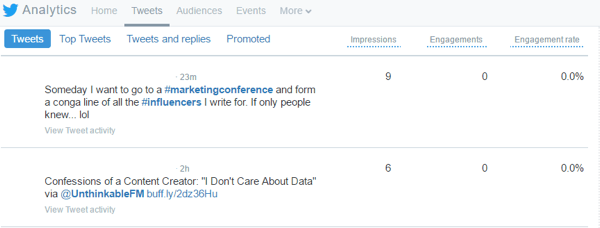
Check out engagement data for individual tweets.
The Engagements column on the right is helpful, but it includes a lot of extra information (basically any interaction with the tweet). If you’re just looking for likes for a particular post, scroll through the graphs on the right until you see Likes. This data shows the daily number of likes that your tweets are receiving, as well as your average likes per day.
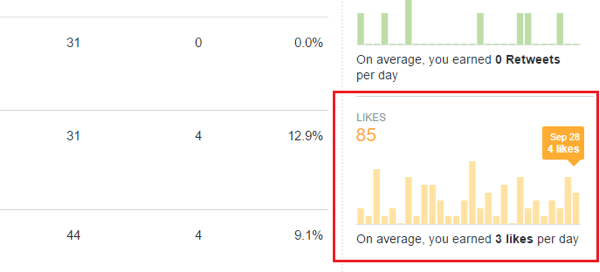
The Likes graph shows the daily number of likes your tweets are receiving.
#4: Monitor Mentions
Your fans and prospects are out there talking about you and you want to be a part of that conversation. For this reason, it’s important to track your mentions. On Facebook, you’ll get notifications whenever someone tags your business/username in their post.
If people are not directly tagging you, you’ll need to use a third-party tool to keep track of mentions on Twitter.
#5: Delve Into Audience Demographics
As you grow your following, monitoring your audience demographics can inform your strategy and help you modify posts and paid ads for future promotions.
Facebook
On Facebook, you can access audience information in your Insights under People. Click the Your Fans section to view various demographic factors for your fan base.
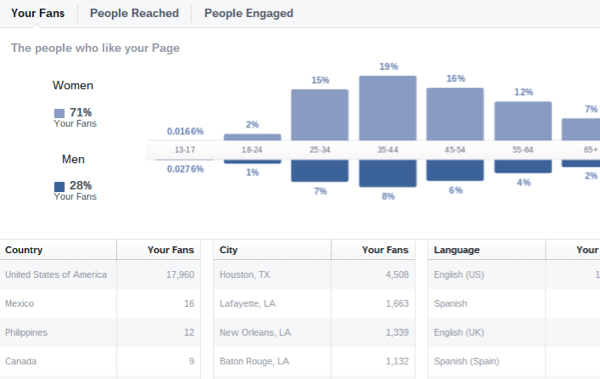
View demographics for your Facebook audience.
Twitter
On Twitter, your analytics data provides audience information related to your followers. Simply click on Audiences to find the relevant information.
You’ll see a broad overview of your audience, as well as specific demographics, lifestyle interests, and other information.
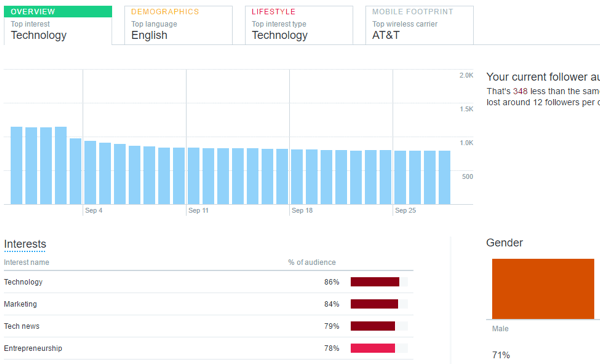
Check out demographics for your Twitter following on the Audiences tab.
If you’re using Twitter for Business with paid advertising, you’ll also have a Brand Hub tab at the top of the page, which includes more in-depth audience demographic information.
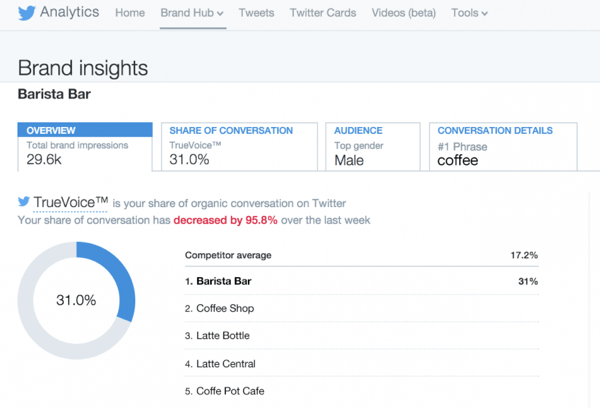
Get more in-depth audience data on the Brand Hub tab.
#6: Determine Reach
The Reach metric combines the number of people you’ve reached both within and outside of your audience. When people engage with your content, their activity is usually shared with their connections, which increases your page’s reach.
Mixing more engaging content into your social strategy can significantly improve the reach of both your posts and your business.
Facebook
On Facebook, go to your Insights tab and click the Reach option in the navigation panel on the left. The top graph you see displays your post reach, which is basically the number of people who saw your post.
Scroll to the bottom of the page to find your total reach. This is the number of people who saw any activity from your page as a result of follower interactions, ads, mentions, check-ins, and so on.
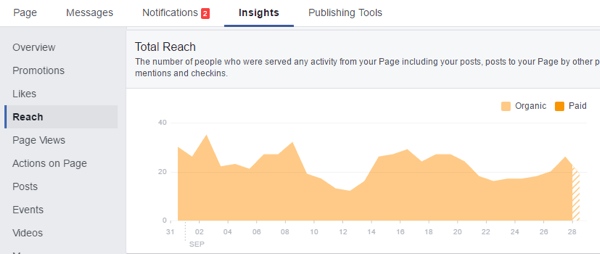
Look at Reach data in your Facebook Insights.
In the top Post Reach graphic, you can click on any given day to view posts that contributed to that day’s post reach count.
Twitter
On Twitter, click the Tweets tab in your analytics to display an Impressions column. This is the number of impressions for each tweet. As people interact with your tweets, the number of impressions will rise as a result of expanded reach.
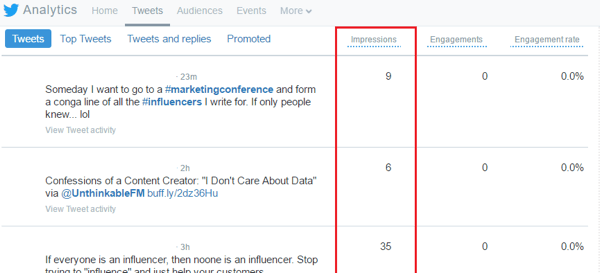
Monitor the number of impressions for individual tweets.
#7: Review Replies and Comments for Your Posts
Replies and comments on your posts can help you gauge how interesting or engaging your topics are. As with reactions, they’re direct response metrics that help you weed out uninteresting content from your publishing schedule.
Because replies are typed out, you can also view individual posts that performed well to measure follower/fan sentiment.
Facebook
To find this information on Facebook, go to your Insights and click the Posts option in the left navigation. Scroll down to All Posts Published and click the right drop-down arrow to view Reactions, Comments, and Shares.
Look at replies and comments on Facebook.
From here, you can view comment counts. If you want more details on the comments and audience sentiment, click on the post link to open the post’s details and read through your followers’ comments.
Twitter
On Twitter, you can easily measure the number of replies for each post, but bringing up replies to your tweets is a little more complicated.
You can view post reply counts in your Twitter analytics. Click the Tweets tab at the top of the page and choose either Tweets or Top Tweets below the graph.
Click on individual tweets to view engagement levels, which include the number of replies you received.
Look at replies for individual tweets.
The graph on the right shows both the total replies for a designated period and the average number of replies for each day.
#8: Find Out What Content Is Being Shared
Content shares are important because they reflect how your audience perceives the value of your content. Highly shared posts indicate that your audience found the topic or type of content particularly helpful, or had a strong emotional or psychological connection to it. The more often content is shared, the greater the reach.
To measure shares on both Facebook and Twitter, follow the above steps for measuring replies and comments. For Facebook, find your shares, and for Twitter focus on retweets.
#9: Track Referral Traffic From Social Media
Acquisition data tells you what kind of traffic you’re getting from social to your website and how that traffic performs once it arrives. If you find one or more social channels aren’t bringing you the number of click-throughs you expected, use this data to improve your calls to action and campaigns.
Unlike the other metrics listed above, you’ll find your referral traffic data in your Google Analytics. Under Acquisition in the left navigation, click on the Social top-level menu. In the menu under Social, click Overview or Network Referrals.
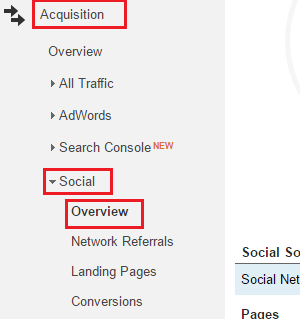
Access your referral traffic in Google Analytics.
The Overview tab provides basic information on total sessions from each social network. On the the Network Referrals tab, view session counts, page views, duration, and pages visited per session.
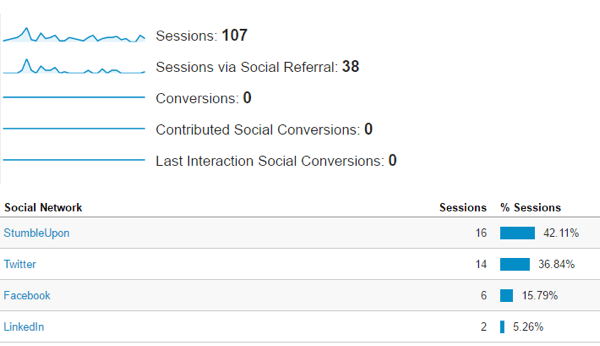
View traffic from social in Google Analytics.
#10: Examine Click Rates
Click rates have everything to do with conversions. Although they don’t specifically focus on revenue generation, clicks help you understand how your followers engage with you, why they’re engaging, and what’s making them click on different links.
Facebook
Facebook has a fairly extensive click-tracking system. If you go to Posts on the Insights tab, you’ll find the number of post clicks for each individual post. This data signifies what content your fans found most interesting or enticing.
Go to Actions on Page in the left navigation to see click counts for various elements(phone, directions, website, call to action, etc.). It also shows clicks based on user demographics.
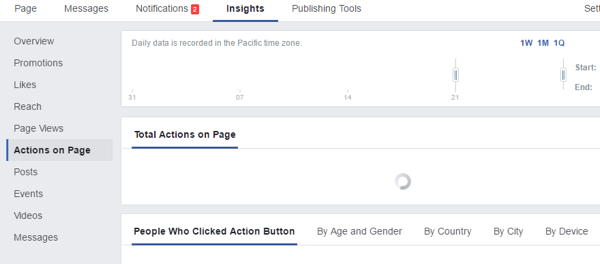
The Actions on Page section shows click counts for various actions.
Twitter
Use the above method for tracking retweets on Twitter to view individual link clicks in posts.
You can also use a service like Buffer or Bit.ly for tracking your link clicks with custom links for different social channels.
Conclusion
Monitoring your brand’s online performance is important, but keeping a close eye on your audience metrics is even more crucial. It’s the best way to create targeted, customized content to improve engagement with your audience.
What do you think? How often do you monitor follower metrics at this level? Does data analysis influence your marketing strategy? Let us know your cool tips and tactics in the comments below.
Source
Source
Thursday, 10 November 2016
Wednesday, 9 November 2016
Saturday, 5 November 2016
5 Digital Marketing Strategies That Can Help Drive Online Sales

Marketing technology changes
rapidly—and if you keep up, it can spell opportunity for you and your brand to
move ahead of the competition.
With so many digital marketing tactics all aimed at driving
online sales, how do you know which are the most cost-effective and efficient?
When it comes to driving qualified traffic to help your site produce sales, the
following five tactics can be incredibly effective at helping to generate
conversions at a low cost.
1. Social Media Marketing
Going beyond organic posts and using the advantages of social
media marketing can hold many opportunities for your brand online. Today, a
company's social media presence is critical to growth, and with the advertising
options that are now available, it's incredibly easy to reach a targeted
audience.
Across social platforms like Instagram and Facebook, you can completely tailor your ad content for the platform in an easy manner. Such channels allow you to select different targeting options based on refined demographics, locations, interests, professions and beyond, allowing you to only spend money toward the users that are going to be most interested in your ad content. Best of all, the platforms are cost-per-click, which definitely helps to keep your budget down. And they offer various ad formats, so you can really customize the style you want to serve your audience with.
Across social platforms like Instagram and Facebook, you can completely tailor your ad content for the platform in an easy manner. Such channels allow you to select different targeting options based on refined demographics, locations, interests, professions and beyond, allowing you to only spend money toward the users that are going to be most interested in your ad content. Best of all, the platforms are cost-per-click, which definitely helps to keep your budget down. And they offer various ad formats, so you can really customize the style you want to serve your audience with.
"Without a thorough understanding of who your customers are and what
they want to know and receive from your brand, it's nearly impossible to foster
engagement"
2. Retargeting Ads
A second-time visitor has a far higher likelihood of converting
than a first-time visitor, so it's essential that you reengage users and bring
them back to your website. Retargeting ads through programs offered by Google
or AdRoll can help you to stay top-of-mind with your users while they consume
content elsewhere on the internet.
This digital advertising can be incredibly cost-effective too,
as you can select an option where you only pay when the user actually clicks
through to your site from the ad. By serving users that are already familiar
with your brand, you're more likely to reengage them and eventually convert
them. Tapping that initial interest is key.
3. Email Marketing
While people receive a ton of promotional emails each day, it's
likely that the average user doesn't receive that many that are truly
interesting and relevant to their needs. With the right email marketing
approach, you can easily communicate with users, reengaging them with a
valuable message and helping to bring them back to your site.
Programs like MailChimp or Constant Contact make it easy to
disseminate emails to lists of users. That being said, in order to send emails
that garner results, you need to send to the right audience, and creating email
lists of users that are interested in your brand can be tricky. The most
effective way to capture user interest and increase sign-ups for your
e-newsletters may be to really provide an incentive. If you're an e-commerce
brand, try offering exclusive deals or special promotions when they sign up for
your newsletters. If there is no real value in your email campaigns, then they
aren't likely to resonate well with users and produce the type of results most
brands seek.
4. Content Marketing
Users don't want content that fails to serve their needs or that
holds no real value. As a brand, if you can produce content that is incredibly
relevant to your audience, whether it is a video tutorial or a “how-to"
post, you can help engage and capture customer attention.
That being said, to effectively create content that resonates with
your audience, it's critical that you listen to their needs and understand them
as users. Without a thorough understanding of who your customers are and what
they want to know and receive from your brand, it's nearly impossible to foster
engagement. Listen to your audience on social media, examine analytics to see
which blog posts tend to perform the best and look for opportunities in the
marketplace where you can fill a gap with what customers are looking for.
Once you have that understanding, leverage your internal experts
to create content that showcases your expertise and skills. Create posts that
experts at your company can use to highlight their knowledge within your
industry, or use design resources to aggregate data to create infographics.
5. Responsive Design
Last, but certainly not least, a responsive design is one of the
most important digital strategies you can use to help your brand online. It's
surprising to see how many brands still don't have a website that is optimized
for mobile.
A responsive design ensures that regardless of the device users
are accessing your site from (mobile, tablet or desktop) they are provided with
a website that is optimized for their screen. This type of design renders to
fit the screen size, ensuring that users aren't faced with any issues in terms
of functionality and usability. Whether it's buttons that are too big for the
screen, or images that require excessive zooming in and out or form fields that
are too difficult to type into on mobile, any of these blunders with your
design can interfere with visitors converting on your site.
To grow your brand online it's essential that you focus on a
strategic approach to digital marketing—and tailor these tactics to help meet
the unique needs of your users.
Photo: iStock
Document, Don't Create
Gary Vaynerchuk, owner of Vayner Media, Social Media Guru, public speaker and motivator. In the beginning of his career he raised his father's wine company's revenue from 3 million to 60 million USD in 3 years.
Subscribe to:
Posts (Atom)