

Wondering how best to analyze your Instagram marketing?
Want to know which metrics will give you the most useful assessments?
Tracking the right Instagram metrics will help you identify successful marketing efforts and show where you can achieve better results.
In this article, you’ll discover how to analyze four important Instagram metrics.
#1: Calculate Conversions to See Where You’re Losing Prospects
The people who come to your website from Instagram are considered warm leads. It’s up to your website to convert them into hot leads, people who are almost ready to buy.
However, some leads become hot right on Instagram. People show they’re interested in making a purchase when they ask about the price or delivery options in comments or direct messages. Obviously, the numbers of inquiries and closed deals show how good you are at selling on Instagram. But they’re not enough if you want to sell more.
Suppose your business sells handmade bags on Instagram. Last year, you had 75 sales per month from an average of 180 Instagram direct messages and comments. Now you want to grow your business. To do that, you’ll need to hire another seamstress, which will increase your expenses. To meet your goals, you’ll need to close 114 deals instead of 75.
Should you publish more sales content on Instagram? Or grow your followers? Or create viral content and launch competitions to reach more people? A sales funnel can help answer these questions.
The people who have seen your Instagram photos but aren’t following your profile are cold leads. The people who saw your Instagram profile, loved it, and started following your account are warm leads.
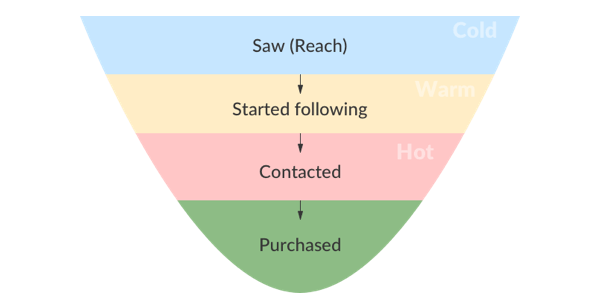
An Instagram sales funnel from cold to hot leads.
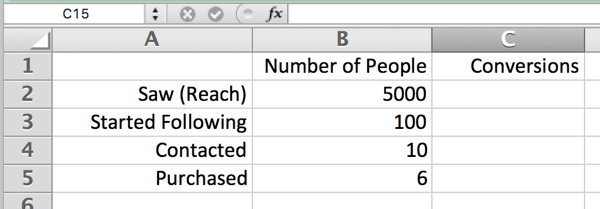
You’ll want to add the four stages of your sales funnel to your performance spreadsheet and fill in the relevant data. You can find data about reach and new followers in your Instagram Insights. To calculate the number of people who contacted you, total the number of incoming Instagram direct messages and comments valuable to your business (e.g., about price, delivery, etc.). This is your funnel.
You’ll find reach and new follower data in your Instagram Insights.
How to Access Instagram Insights
To get access to Instagram Insights, you need to convert your account to an Instagram business profile. From there, tap the bar graph icon in the upper-right corner of your profile to see your analytics.
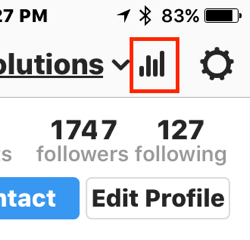
Tap the bar chart icon to access your Instagram Insights.
To find out where you’re losing prospects, calculate conversions at each stage of the funnel. For the Started Following stage, divide new followers by reach.
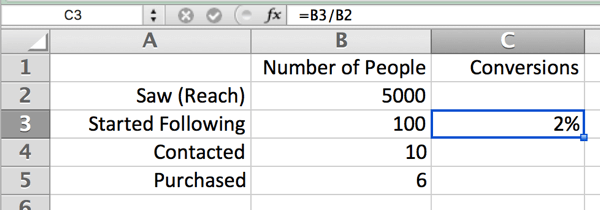
You can calculate the conversions of your Instagram sales funnel in your spreadsheet.
For the Contacted stage, divide contacts by new followers.
Divide contacts by new Instagram followers for the Contacted stage.
For the Purchased stage, divide purchases by contacts.
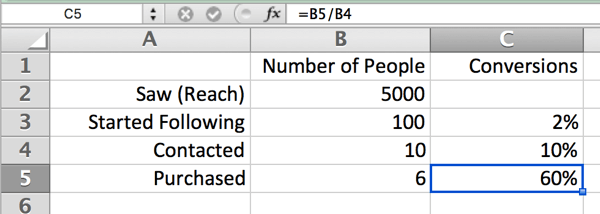
Divide purchases by contacts for the Purchased stage.
The sales funnel allows you to visualize a user’s path from cold lead to purchase. On your spreadsheet, you’ll be able to clearly see where your weaknesses are and the stages you need to optimize to grow your business.
Here’s the sales funnel for the example above:
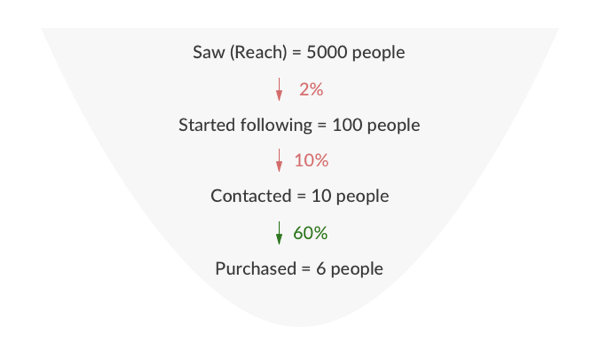
Look at conversions for each stage of your Instagram funnel to see where you’re losing prospects.
#2: Determine Follower Growth Rate to Benchmark Growth Goals
You can clearly see the number of followers above your Instagram profile’s bio. But what does that number really tell you about the growth of your community?
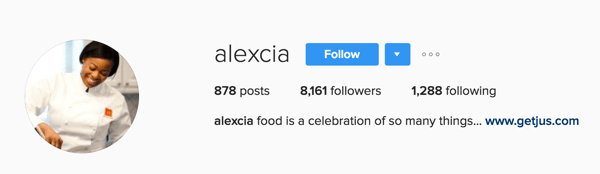
You can view your number of Instagram followers above your profile’s bio.
The number of total followers doesn’t mean anything in and of itself. Unsubscribed people along with newbies can slow the growth of your profile. Unexpected mentions and embedded posts can give you a brief rise in the number of followers.
To make it easier to track follower growth over time, use a tool like Google Sheets. To get started, add a row to your spreadsheet to track your total followers by month. The follower data in the example below reveals the audience is growing.
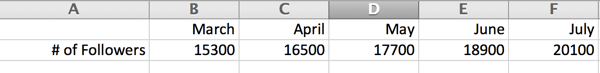
Add your total number of Instagram followers for each month.
Now you want to focus on how many new followers you’re getting each month. Add another line to your spreadsheet for new followers. To calculate this number, take the total followers for the month and subtract the previous month’s total followers. This gives you the total new followers for each month.
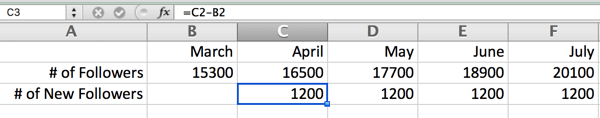
Enter your total number of new Instagram followers for each month.
Next, add a line to your spreadsheet for growth rate. To calculate this number, take the total new followers for the month and divide by the total followers from the previousmonth.
Here’s the formula to calculate follower growth rate:
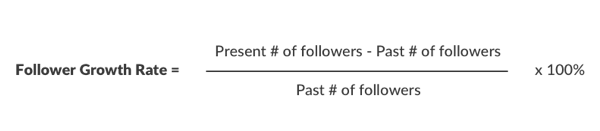
Use this formula to calculate your follower growth rate on Instagram.
If you’re getting around the same number of new followers each month, it doesn’t mean you’re seeing stable growth in your community. In the example below, despite the same number of new followers each month (1200), the growth rate is decreasing.
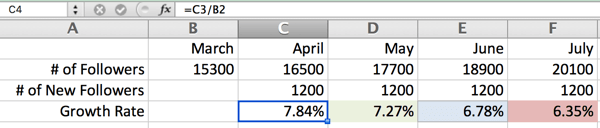
Calculate the follower growth rate for Instagram.
The growth rate shows how fast your community is expanding and identifies which months you’ve performed best and worst. When you know the growth rate, you can set key performance indicators and better predict how many new people will follow you in the coming months.
If you don’t meet your growth goals, it’s time to analyze which factors are slowing growth. There can be different reasons for it, from irrelevant content (people are unfollowing your account) to low promotion (people can’t find you).
#3: Monitor Comment Engagement to Gauge Follower Sentiment
“Likes” on Instagram are an indication that people are interested in the content you publish. But how do you know what aspects of your content they like?
Take the Instagram post below as an example. Of the 317 users who liked this post, some might be interested in the company’s product (the puffy jacket), while others might be taken by the composition and color balance in the photo.
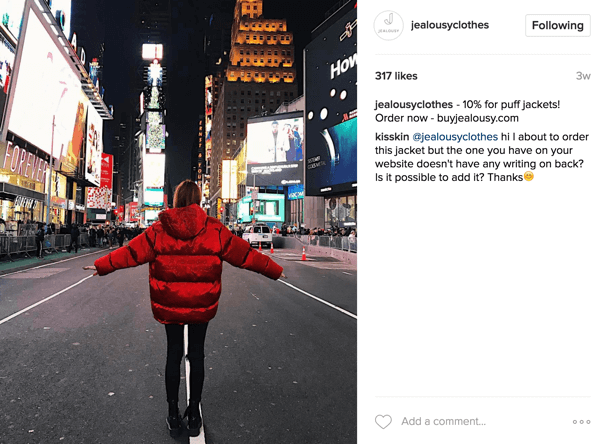
This Instagram post has received a lot of likes, but just one comment.
Remember, too, that a like on Instagram is an easy action. Users can just double tap the heart icon and then continue scrolling their feed.
Truly engaged followers, on the other hand, will applaud a photo through a comment. They’ll answer a question you’ve asked in your post. If you’re selling products, they may ask about the price and delivery in the comments.

Asking a question in an Instagram post can prompt comments from an engaged community.
Moreover, compared to likes, comments give more weight to your content and make it easier for people to find you.
Simply Measured is a free tool that allows you to track comments and other metrics on Instagram. You’ll get a comprehensive Instagram analytics report with valuable statistics in exchange for following the company on Twitter. It’s a good deal.
On the Simply Measured Engagement chart, you can see how the numbers of likes and comments have changed over time.
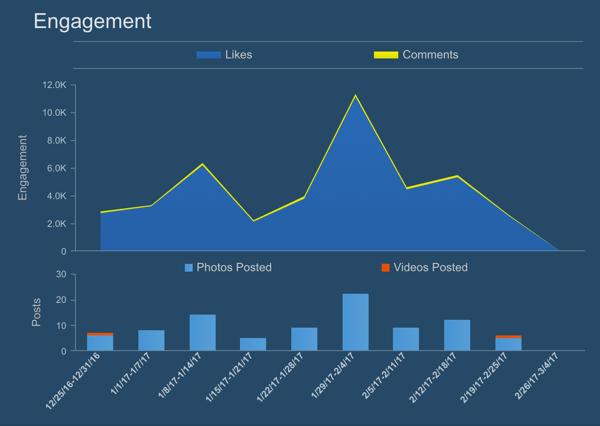
Simply Measured shows a graph of Instagram engagement (likes and comments) over time.
Even more important is to find out the average number of comments per photo (13.3 in the example below). Be sure to add this data to your spreadsheet. When you look at this number over time, you can see whether commenting is on an upward or downward trend.
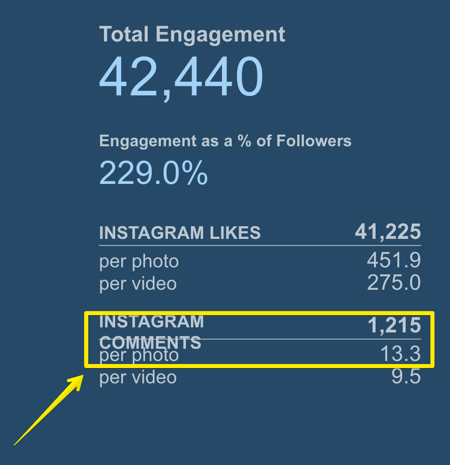
Track how many comments the average Instagram post gets with Simply Measured.
If you want to go a step further, analyze what people are writing in comments, as shown below. Be sure to add your Simply Measured engagement data to your performance spreadsheet. Choose a reporting period for downloading statistics and then add key numbers to your sheet.
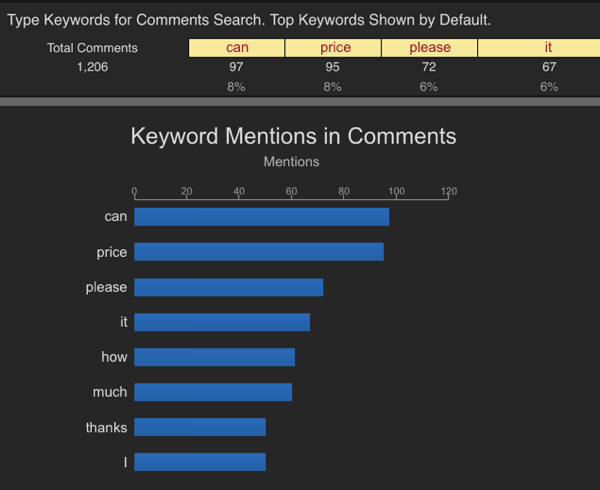
It’s important to track not only the quantity of Instagram comments but also their sentiment.
#4: Track Click-through Rate to Measure Referral Traffic
If you use Instagram to drive traffic to your website or blog, you’ll want to track clicks.
The easiest way to see total clicks is with Instagram Insights. Tap the bar graph icon in the upper-right corner of your profile. You can then see the number of times the links in your bio have been clicked for a specific time period.
If you want more detailed information, add Google UTM parameters to the links you share in your Instagram bio. Then in your Google Analytics, you’ll be able to see how many people clicked the link in the bio, what link they clicked, and what people did after that.
Add UTM parameters to your links to track Instagram referral traffic.
To access these stats in Google Analytics, go to Acquisition > Campaigns > All Campaigns.
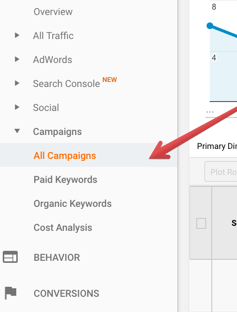
You can track UTM codes in Google Analytics.
Now you can see your traffic from Instagram.
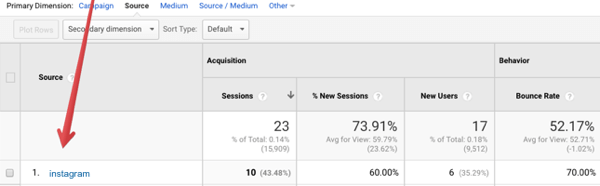
View data about your Instagram referral traffic in Google Analytics.
What do UTM codes bring to your analytics? With UTM codes, you can calculate the click-through rate (CTR) for each link you share. The CTR is the ratio of users who clicked on a link to the number of users who saw it.
If you’re calculating CTR for Facebook posts, you simply compare the reach and number of clicks for each post. But on Instagram, you can’t attach clickable links to posts unless they’re ads. What you can do is change the links in your bio and refer users to your bio in your post.
So to calculate CTR on Instagram, take the number of clicks for a unique link divided by the number of people who viewed the post.
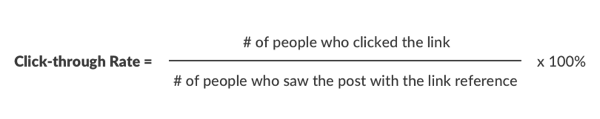
Use this formula to calculate CTR for each Instagram post.
Be sure to include a column for CTR on your performance spreadsheet.
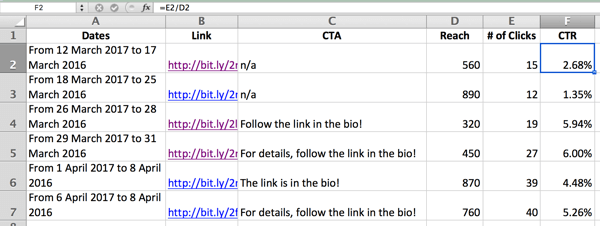
In your Instagram performance spreadsheet, note CTRs and conversions, as well as key factors that may influence them.
If you track goals in Google Analytics, you can also add information about completed goals such as purchases, video views, subscriptions, signups, and so forth. This lets you see how relevant the traffic you’re driving to your website is and whether people actually convert to customers.
Also, note the call to action you used in your post or any other factors that you believe influence CTR. This will help you develop a formula that encourages users to click the links you share.
Bonus: Monitor Hashtag Popularity to Identify Refined Hashtag Opportunities
When you’re choosing which hashtags to add to your Instagram posts, it’s tempting to pick the most popular ones.
However, if you use popular (high-volume) hashtags with the hopes of ranking high in Instagram search, your posts will need to be extremely relevant and have enough weight (comments and likes) to rank high. For these reasons, it’s difficult for small- and medium-sized businesses to compete with large businesses that use the same hashtags.
Small- and medium-sized businesses are likely to see better results with low- and medium-volume hashtags because there are fewer people searching for them. If you use the hashtag #flowerslondon, for example, you’re targeting a geographic location. With #flowertattoo, you’re targeting your audience by interests.
To research hashtags, use tools like Keyhole or Hashtagify. They’ll show you how often hashtags are used and allow you to compare them.
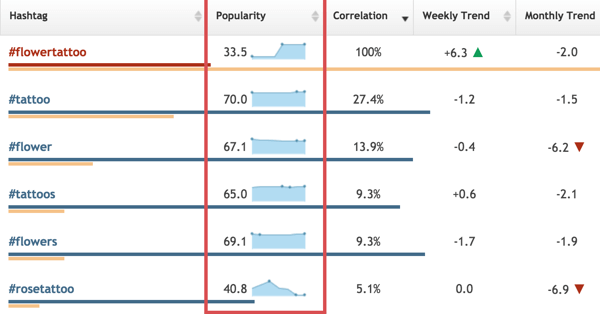
In Hashtagify, you can compare hashtags based on their popularity.
If the tool you use doesn’t offer statistics on hashtag popularity or volume, you can use frequency of usage as a base metric. The number of posts per hour metric gives you information about the time your post will be in the first section of recent posts, right below top posts.
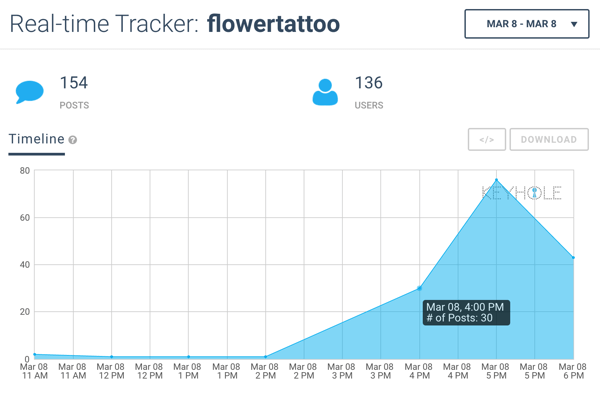
The frequency of usage metric can predict how long your Instagram post will be trending.
For example, if you choose #flowertattoo and your image doesn’t have enough weight to be ranked at the top, your post could still be among the first listed for the hashtag for a specific hour of the day.
These five metrics give you valuable insights into the effectiveness of your Instagram marketing and help you identify areas where you can improve performance on the platform.
What do you think? Do you track these metrics to evaluate your Instagram marketing performance? What additional analytics do you measure? Please share your thoughts in the comments below.
No comments:
Post a Comment